Portfolio
Advertisements
The month ended with losses of USD 3968.46 based on current unrealized gain/loss.
| Jan 24 | USD (3012.20) |
| Feb 24 | USD (3968.46) |
| Mar 24 | USD (4742.00) |
GME, JD and UPST mainly contribute to the losses.
QYLD gain me USD 89.00 in dividends for March
| Ticker | Shares | Current price | Average price | Total Value | Current Value | Gain/Loss | Remarks |
| QYLD | 500.00 | 17.94 | 17.29 | 8645.00 | 8970.00 | 325.00 | Dividend |
| SPY | 2.00 | 522.16 | 395.08 | 790.16 | 1044.32 | 254.16 | Long Term |
| GME | 100.00 | 11.99 | 25.00 | 2500.00 | 1199.00 | -1301.00 | Options Trade |
| JD | 100.00 | 27.76 | 40.00 | 4000.00 | 2776.00 | -1224.00 | Options Trade |
| AI | 100.00 | 26.40 | 33.00 | 3300.00 | 2640.00 | -660.00 | Options Trade |
| UPST | 100.00 | 26.43 | 42.00 | 4200.00 | 2643.00 | -1557.00 | Options Trade |
In March the total realized gain/loss is as below
| Symbol | S/T Profit | S/T Loss | L/T Profit | L/T Loss | Total |
| AI | 275.11 | 0 | 0 | 0 | 275.11 |
| GME | 0 | 0 | 0 | 0 | 0 |
| JD | 0 | 0 | 0 | 0 | 0 |
| PYPL | 349.57 | 0 | 0 | 0 | 349.57 |
| QYLD | 0 | 0 | 0 | 0 | 0 |
| RILY | 197.47 | 0 | 0 | 0 | 197.47 |
| SPY | 0 | 0 | 0 | 0 | 0 |
| UPST | 0 | 0 | 0 | 0 | 0 |
| Total Stocks | 822.16 | 0 | 0 | 0 | 822.16 |
It was a good month to close with USD 822.16 realized gains
There is no realized loss for March
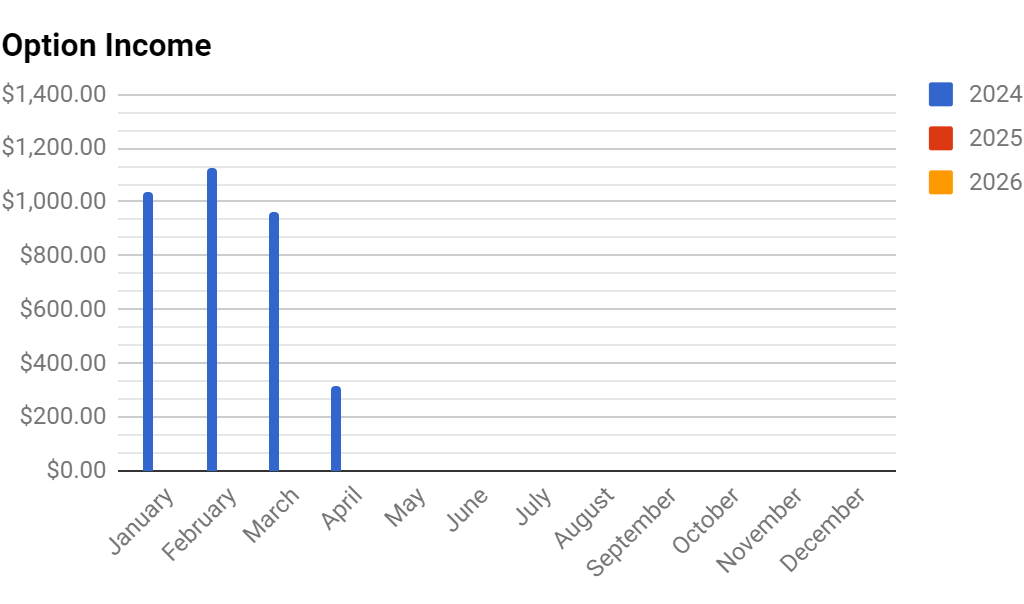
The table below shows my Call/Put options selling gain
| Monthly Option Income per Year | |||
| Month | 2024 | 2025 | 2026 |
| January | $1,040.34 | $0.00 | $0.00 |
| February | $1,125.08 | $0.00 | $0.00 |
| March | $962.30 | $0.00 | $0.00 |
| April | $314.71 | $0.00 | $0.00 |
| May | $0.00 | $0.00 | $0.00 |
| June | $0.00 | $0.00 | $0.00 |
| July | $0.00 | $0.00 | $0.00 |
| August | $0.00 | $0.00 | $0.00 |
| September | $0.00 | $0.00 | $0.00 |
| October | $0.00 | $0.00 | $0.00 |
| November | $0.00 | $0.00 | $0.00 |
| December | $0.00 | $0.00 | $0.00 |
| YTD Total | $3,442.43 | $0.00 | $0.00 |
For those who prefer to see it in a chart