Portfolio
Advertisements
The month ended with losses of USD 3012.20 based on current unrealized gain/loss.
GME and JD mainly contribute to the losses.
| Ticker | Shares | Current price | Average price | Total Value | Current Value | Gain/Loss | Remarks |
| AI | 100.00 | 31.18 | 29.50 | 2950.00 | 3118.00 | 168.00 | Options Trade |
| GME | 100.00 | 14.73 | 25.00 | 2500.00 | 1473.00 | -1027.00 | Options Trade |
| JD | 100.00 | 22.89 | 40.00 | 4000.00 | 2289.00 | -1711.00 | Options Trade |
| QYLD | 500.00 | 17.87 | 17.29 | 8645.00 | 8935.00 | 290.00 | Dividend |
| SPY | 2.00 | 500.98 | 395.08 | 790.16 | 1001.96 | 211.80 | Long Term |
| UPST | 100.00 | 35.47 | 42.00 | 4200.00 | 3547.00 | -653.00 | Options Trade |
| PYPL | 100.00 | 60.09 | 63.00 | 6300.00 | 6009.00 | -291.00 | Options Trade |
In Jan the total realized gain/loss is as below
One stock that closed with a gain is SE with USD 971.44
There is no realized loss for the period of Jan
| Symbol | Realized S/T Profit | Realized S/T Loss | Realized L/T Profit | Realized L/T Loss | Realized Total |
| AI | 0 | 0 | 0 | 0 | 0 |
| CVNA | 0 | 0 | 0 | 0 | 0 |
| GME | 0 | 0 | 0 | 0 | 0 |
| JD | 0 | 0 | 0 | 0 | 0 |
| PYPL | 0 | 0 | 0 | 0 | 0 |
| QYLD | 0 | 0 | 0 | 0 | 0 |
| SE | 971.4458 | 0 | 0 | 0 | 971.4458 |
| SPY | 0 | 0 | 0 | 0 | 0 |
| UPST | 0 | 0 | 0 | 0 | 0 |
| 971.4458 | 0 | 0 | 0 | 971.4458 |
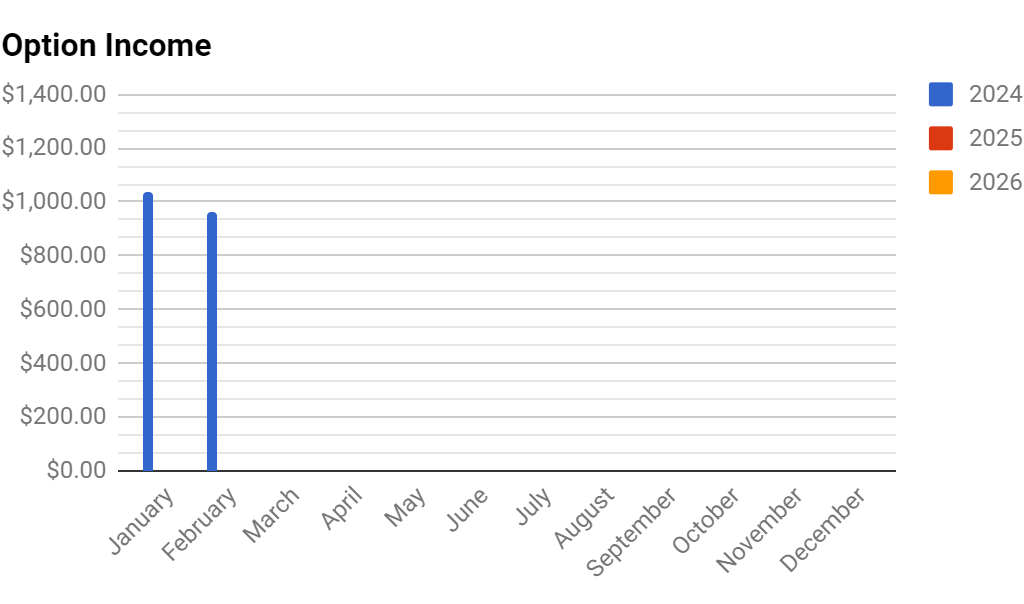
The table below shows my Call/Put options selling gain
| Monthly Option Income per Year | |||
| Month | 2024 | 2025 | 2026 |
| January | $1,040.34 | $0.00 | $0.00 |
| February | $961.13 | $0.00 | $0.00 |
| March | $0.00 | $0.00 | $0.00 |
| April | $0.00 | $0.00 | $0.00 |
| May | $0.00 | $0.00 | $0.00 |
| June | $0.00 | $0.00 | $0.00 |
| July | $0.00 | $0.00 | $0.00 |
| August | $0.00 | $0.00 | $0.00 |
| September | $0.00 | $0.00 | $0.00 |
| October | $0.00 | $0.00 | $0.00 |
| November | $0.00 | $0.00 | $0.00 |
| December | $0.00 | $0.00 | $0.00 |
| YTD Total | $2,001.47 | $0.00 | $0.00 |
For those who prefer to see it in a chart