Portfolio
Advertisements
The YTD gain for my account
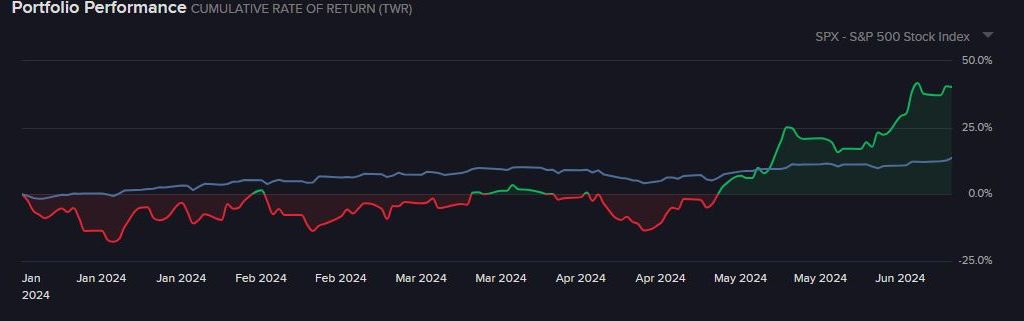
The month I ended with losses of USD 2610.00 based on current unrealized gain/loss.
| Jan 24 | USD (3012.20) |
| Feb 24 | USD (3968.46) |
| Mar 24 | USD (4742.00) |
| Apr-24 | USD (3582.00) |
| May-24 | USD (2612.00) |
UPST mainly contribute to the losses.
QYLD and JD gained me USD 157.32 in dividends for April
| Ticker | Shares | Current price | Average price | Total Value | Current Value | Gain/Loss | Remarks |
| QYLD | 500.00 | 17.80 | 17.29 | 8645.00 | 8900.00 | 255.00 | Dividend |
| GME | 100.00 | 29.12 | 25.00 | 2500.00 | 2912.00 | 412.00 | Options Trade |
| UPST | 200.00 | 23.07 | 40.25 | 8050.00 | 4614.00 | -3436.00 | Options Trade |
| ARKK | 100.00 | 44.38 | 33.00 | 3300.00 | 4438.00 | 1138.00 | Options Trade |
In May the total realized gain/loss is as below
| Symbol | S/T Profit | S/T Loss | L/T Profit | L/T Loss | Total |
| GME | 0 | 0 | 0 | 0 | 0 |
| JD | 0 | -1,133.46 | 0 | 0 | -1,133.46 |
| TSLA | 497.59 | 0 | 0 | 0 | 497.59 |
| Total Stocks | 497.59 | -1,133.46 | 0 | 0 | -635.87 |
There is a gain from TSLA with USD 497.59 profit
Realized loss for April is USD 635.87 due to JD
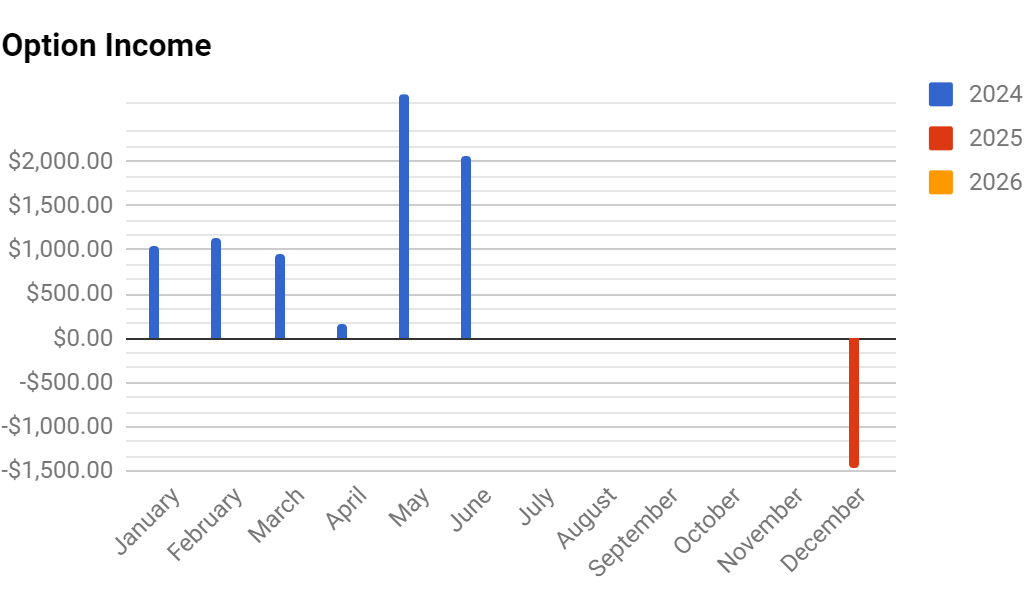
The table below shows my Call/Put options selling gain or losses
| Monthly Option Income per Year | |||
| Month | 2024 | 2025 | 2026 |
| January | $1,040.34 | $0.00 | $0.00 |
| February | $1,125.08 | $0.00 | $0.00 |
| March | $962.30 | $0.00 | $0.00 |
| April | $170.54 | $0.00 | $0.00 |
| May | $2,758.62 | $0.00 | $0.00 |
| June | $2,057.89 | $0.00 | $0.00 |
| July | $14.86 | $0.00 | $0.00 |
| August | $0.00 | $0.00 | $0.00 |
| September | $0.00 | $0.00 | $0.00 |
| October | $0.00 | $0.00 | $0.00 |
| November | $0.00 | $0.00 | $0.00 |
| December | $0.00 | -$1,455.14 | $0.00 |
| YTD Total | $8,129.63 | -$1,455.14 | $0.00 |
For those who prefer to see it in a chart